
Over the past decade, the FTSE EPRA Nareit Developed Europe Index has exhibited a strong negative correlation (-0.71) between its quarterly total return and market breadth. This implies that during periods of strong index performance, fewer stocks beat the benchmark, and vice versa.
As Research and Indexes Analyst at EPRA, Giovanni Curatolo explains, this pattern is largely driven by the index’s market-cap-weighted structure, which creates significant concentration at the top. On average, the 30 largest companies in the index accounted for 72% of the total free-float market cap over the last ten years, even though the index included around 104 constituents.
For comparison, the FTSE Developed Europe All Cap Index is less top-heavy, with its largest 30 stocks representing only 37% of the total as of August 2025. This concentration means that the index’s performance is often dominated by a small subset of large-cap firms.
However, when examining companies ranked 31st to 80th in the index, a different picture emerges. An equally weighted portfolio of these mid-cap names outperformed the overall index nearly sevenfold over the past decade.
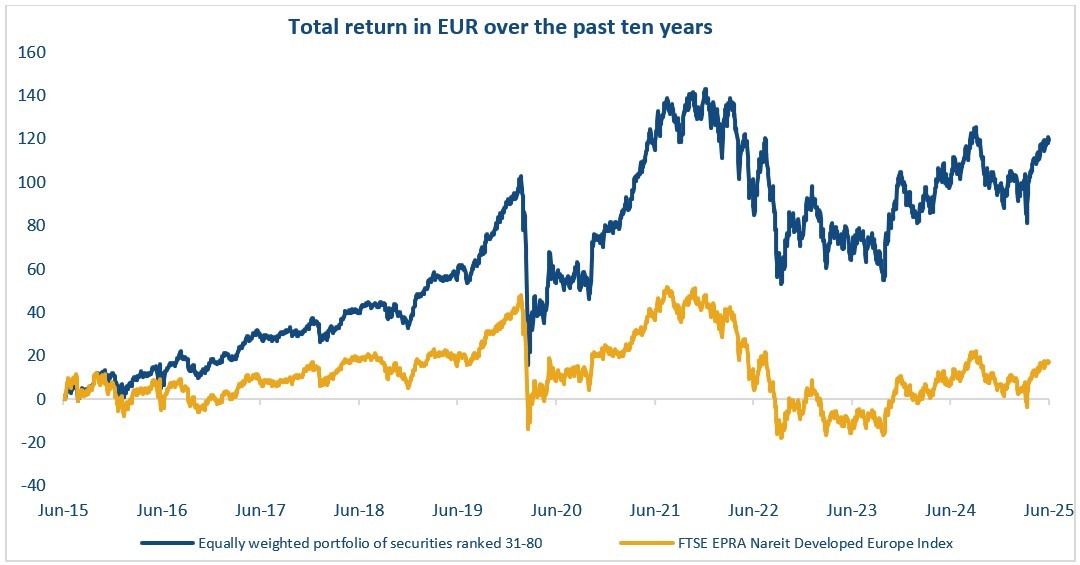
These firms, though less visible and less liquid, appear to offer significant alpha opportunities—particularly attractive for active managers willing to look beyond the index heavyweights.
Looking at broader trends, the data shows that in more than a third of all quarters since 2015, over 50% of the index’s constituents outperformed the benchmark. Importantly, 60% of those outperformers came from the 31–80 rank group, with this segment posting an average market breadth of 52%. This reinforces the idea that mid-cap stocks within the index have been reliable drivers of outperformance.
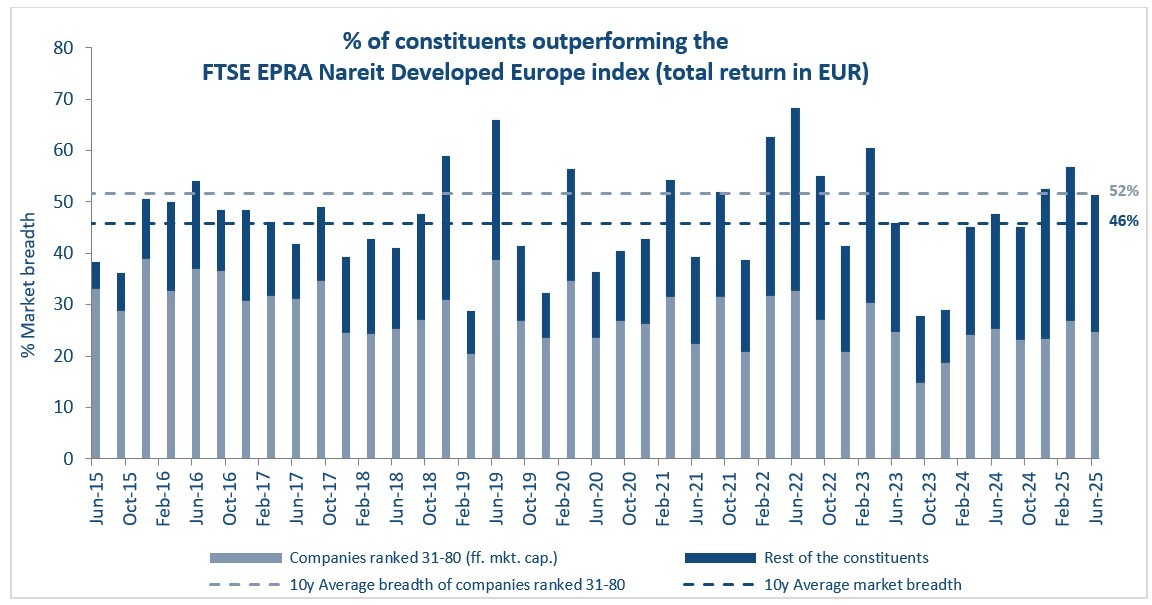
As of June 2025, market breadth stood at 51%, and had reached 57% in Q1 2025—both well above the long-term average of 46%. These figures suggest a more favourable environment for active investment strategies, especially those that focus on mid-sized real estate companies often overlooked by passive index funds.


